Liquidity Void
The Simple Version
A Liquidity Void is a gap between candle bodies. Not wicks like an FVG, but the actual bodies don’t touch. This happens when price moves so fast that candles skip over each other.
Price usually comes back to fill at least part of this gap.
What It Looks Like
Look at consecutive candles during a fast move. Check if the body of one candle touches the body of the next. If there’s space between them, that’s a Liquidity Void.
Key difference from FVG: FVGs are measured wick-to-wick. Voids are measured body-to-body. Voids show more extreme imbalance.
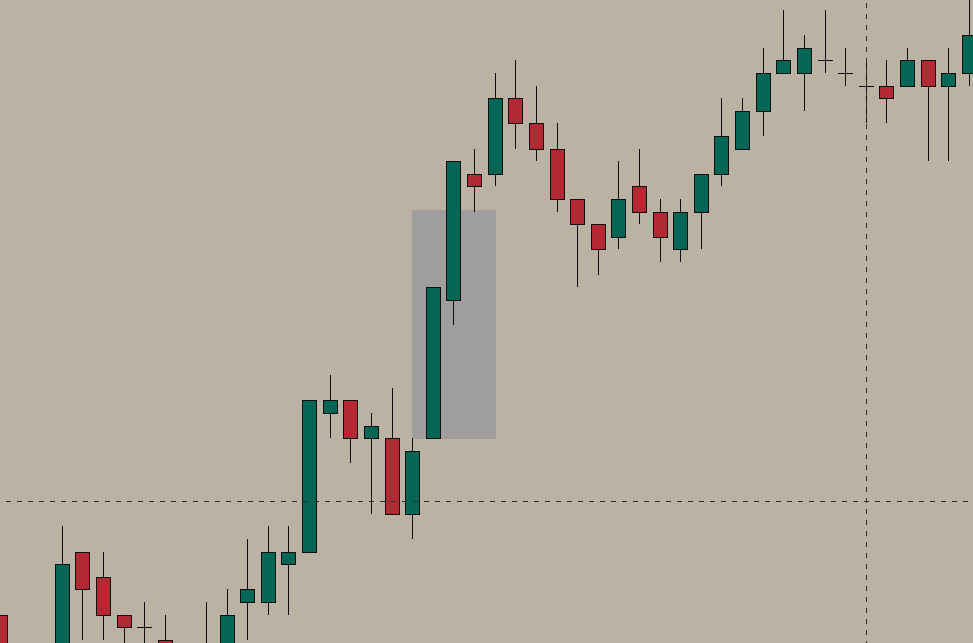 Bullish Liquidity Void
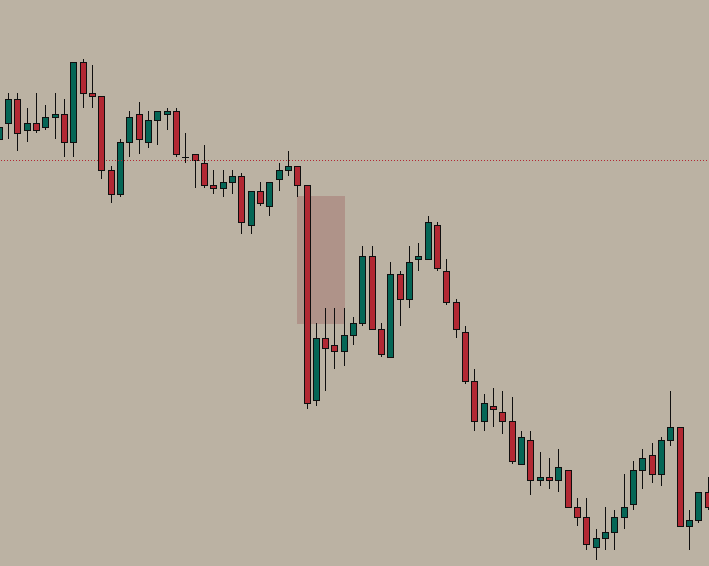 Bearish Liquidity Void
Why It Works
When price moves extremely fast, buyers and sellers don’t get to trade at those prices. The market leaves “unfinished business” behind.
Price tends to return and fill at least 50% of the void. Think of it as the market correcting its own inefficiency.
Spotting a Void
- Find a very fast, aggressive move
- Check if candle bodies touch each other
- If there’s space between bodies, you have a Void
- Mark the body-to-body gap
- Note the 50% level
How to Use It
As a target: Voids act as magnets. If price is heading toward an unfilled Void, expect it to fill at least 50%.
As context: Unfilled Voids tell you where imbalance exists in the market.
As entry (less common): You can enter when price returns to the Void, but this works better as a target than an entry.
When It Fails
Voids created by major news can stay unfilled for hours or days. Don’t assume every Void fills immediately.
Very old Voids lose relevance. Focus on fresh ones.
Quality Check
High-quality Void:
- Clear body separation
- Created during high-impact event (news, session open)
- In direction of the bigger trend
- Fresh, not stale
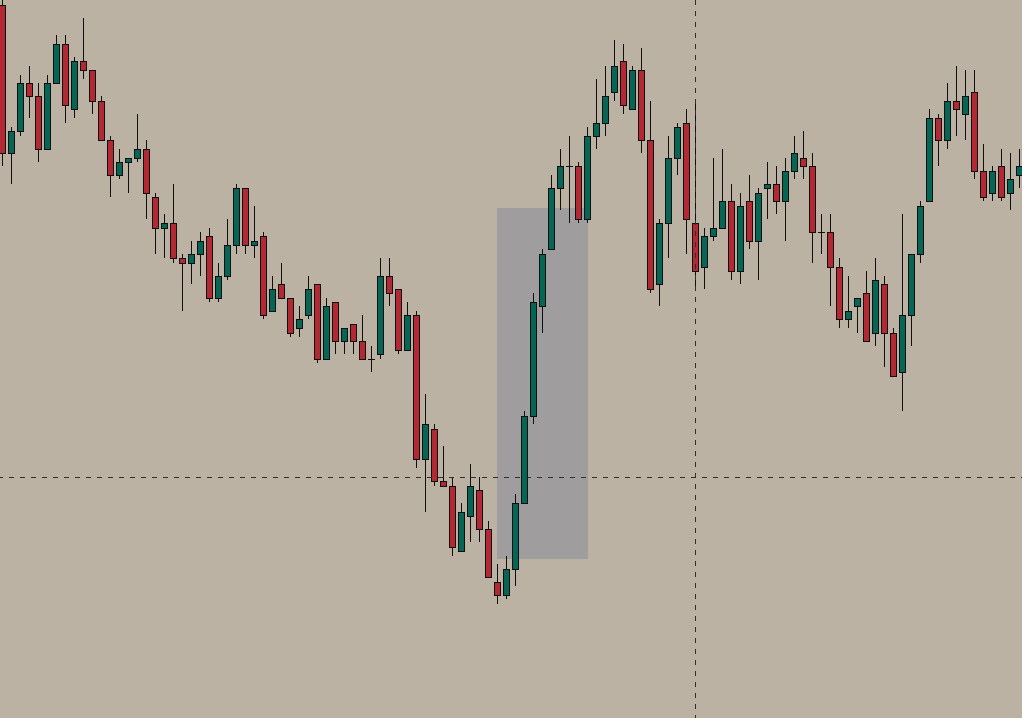 Large Liquidity Void
Low-quality Void:
- Barely any separation
- Created during low-volume period
- Against the bigger trend
- Already partially filled
Common Mistakes
Confusing Voids with FVGs. FVGs are wick-to-wick. Voids are body-to-body. They’re different.
Expecting complete fills. 50% fill is common. Complete fills happen on reversals, not always.
Trading against momentum. If the trend is strong, don’t expect a full retrace just because a Void exists.
Voids and IPDA
Liquidity Voids on their own are just patterns. They have no statistical edge in isolation. What gives them power is context - when they align with a trading model.
Example: The algorithm seeks efficiency. Voids represent inefficiency that the market wants to correct. When you see price heading toward an unfilled Void during a retracement, IPDA logic suggests it will fill at least 50% before continuing. Use Voids as targets within your model, not as standalone trade ideas.
Quick Checklist
- Candle bodies don’t touch
- Clear body-to-body gap
- Created during significant move
- 50% level marked
- Used primarily as target, not entry