Change in State of Delivery (CISD)
The Simple Version
CISD happens when price closes through a series of opposing candles. If you have 3+ red candles in a row and then a green candle closes above all of them, that’s a bullish CISD. The opposite for bearish.
It shows that control has shifted from one side to the other.
What It Looks Like
Look for a series of candles all closing in the same direction (at least 3). Then look for a single candle that closes beyond the entire series.
Bullish CISD: 3+ red candles, then a green candle closes above them all. Bearish CISD: 3+ green candles, then a red candle closes below them all.
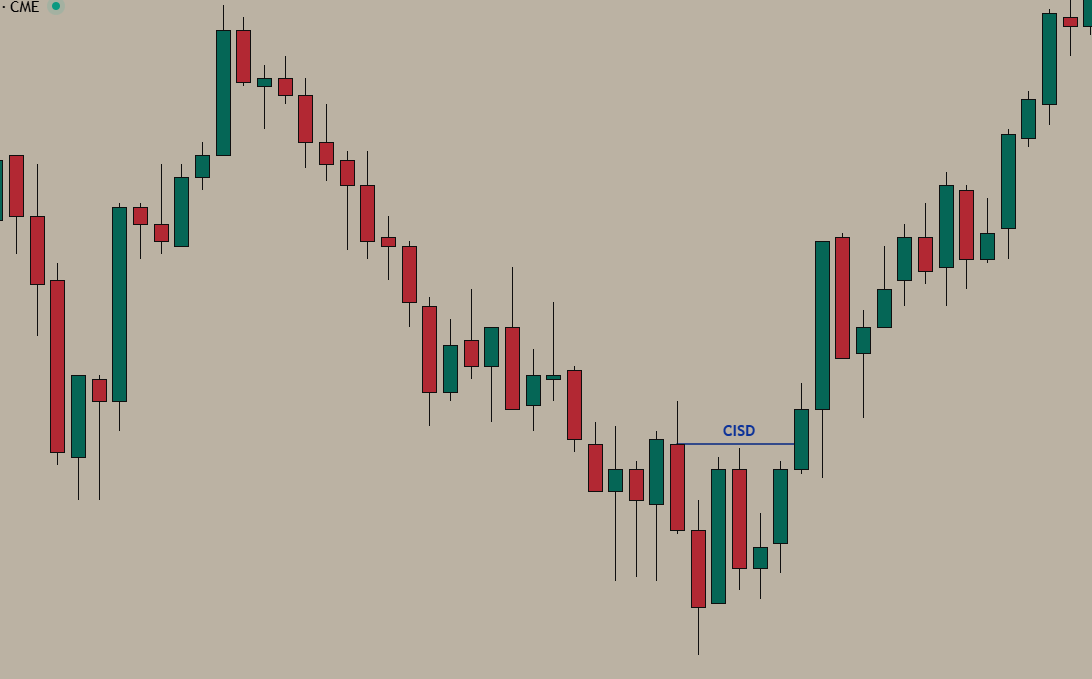 Bullish CISD
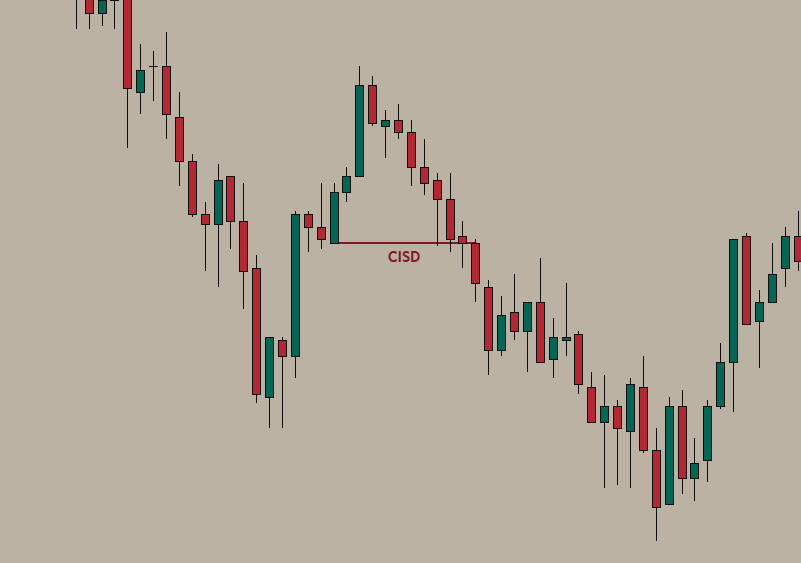 Bearish CISD
Why It Works
A series of same-direction candles shows one side is in control. When a single candle closes through all of them, it shows the other side has taken over.
It’s a visual confirmation that momentum has shifted.
How to Find It
- Find 3 or more consecutive candles closing in the same direction
- Wait for a candle to close beyond the entire series
- The close must be beyond the body of the first candle in the series
- Mark the series as a zone (it becomes support or resistance)
Using CISD
CISD works two ways:
As entry: Enter when the CISD candle closes, trading in the new direction.
As confirmation: Already have a setup at an Order Block or FVG? Wait for CISD to confirm before entering.
Stop: Beyond the series.
Target: Next significant level in the new direction.
When It Fails
CISD is invalid when:
- Price closes back through the series in the original direction
- The series keeps flip-flopping (messy, avoid)
- It happens during low-volume periods (less reliable)
Quality Check
High-quality CISD:
- 4-5 consecutive candles in the series
- Strong closing candle with displacement
- Happens during London or New York session
- Aligns with the bigger trend
- Creates an FVG on the break
Low-quality CISD:
- Only 3 candles (bare minimum)
- Weak close, barely through
- Happens during Asia or lunch hour
- Goes against the bigger trend
What Happens After
After a CISD, the broken series becomes a zone. This is sometimes called a Propulsion Block.
- Bullish CISD: the red candles become support
- Bearish CISD: the green candles become resistance
Price often returns to this zone for a re-entry opportunity.
Common Mistakes
Calling CISD on a wick. Must be a body close through the series, not just a wick.
Ignoring the bigger picture. A 5-minute CISD against the 1-hour trend is noise.
Forcing CISD on 2 candles. You need at least 3 consecutive candles. Two isn’t enough.
CISD in the 2022 Model
CISD on its own is just a pattern. It has no statistical edge in isolation. What gives it power is context - when it aligns with a trading model.
Example: After a liquidity sweep and approach to a PD array (Order Block, FVG), CISD becomes your confirmation trigger. You’re not entering blindly at the array - you’re waiting for CISD to confirm that institutions agree with your direction. The sweep + PD array + CISD combination is what creates the edge.
Quick Checklist
- 3+ consecutive candles closing same direction
- Single candle closes beyond entire series
- Body close (not just wick)
- Happens during active session
- Aligns with bigger trend
- Series marked as zone for potential re-entry